Teamup Ticker
▶️ Using Table View
Fri Jul 11, 2025
.Ticker > Interactive Demos
Interactive demo: Using Table view
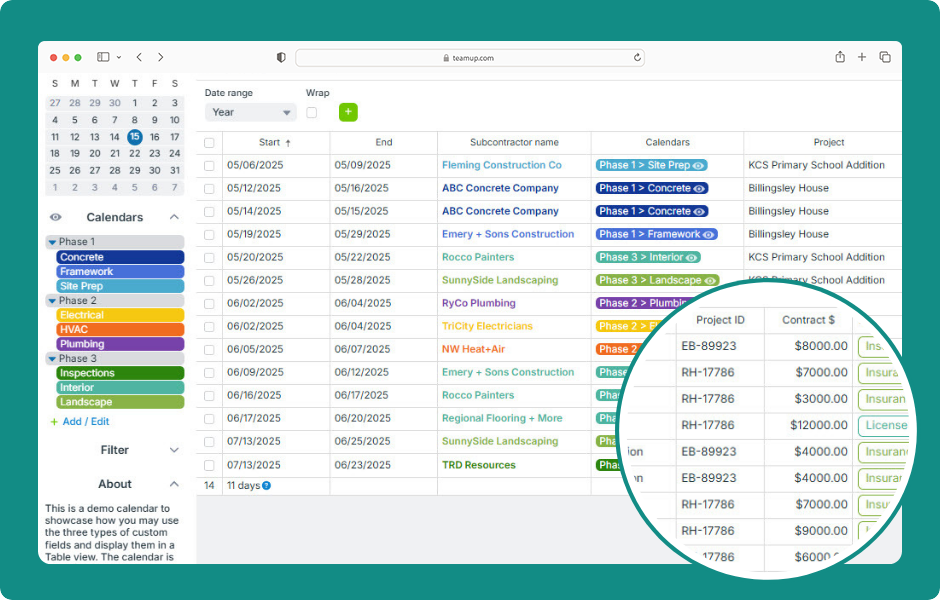
Table view (browser only) provides a spreadsheet-like tabular view of calendar events. Each event field is shown in its own column (including custom fields) and each event in its own row.
Like all the other calendar views, events can be filtered and sorted by various criteria. For custom fields for numerical values, Table view will display the sum.
- Open Teamup in a browser.
- Select Table in the view picker (top right).
- Select Wrap to have all text wrapped.
- Adjust the date range as needed.
- Hover the mouse over an event title to view a pop-up preview of event details.
- Click an event title to open the event editor.
- Hover over a column name then click the arrow for column options.
- Select Hide column to remove that column from view.
- Use Move Left and Move Right to rearrange columns.
- Sort events by any column. Choose alphabetical (A-Z) or reverse alphabetical (Z-A) sorting.
- To sort events by a second column as well, select Sort by additional column, then choose A-Z or Z-A sorting.
- The contents of number fields will be summed automatically in the footer row.
- The event duration will be summed in the footer row of the Start column.
- Click and drag a column’s border to resize it.
- View event history in the Created and Updated columns.
- Click Show/Hide columns to adjust which columns are displayed.
ℹ️ Learn more
table view, interactive, demo, calendar views, spreadsheet, report, columns, layout, display