Teamup Ticker
Using Year view and Table view to get better insights from calendar data
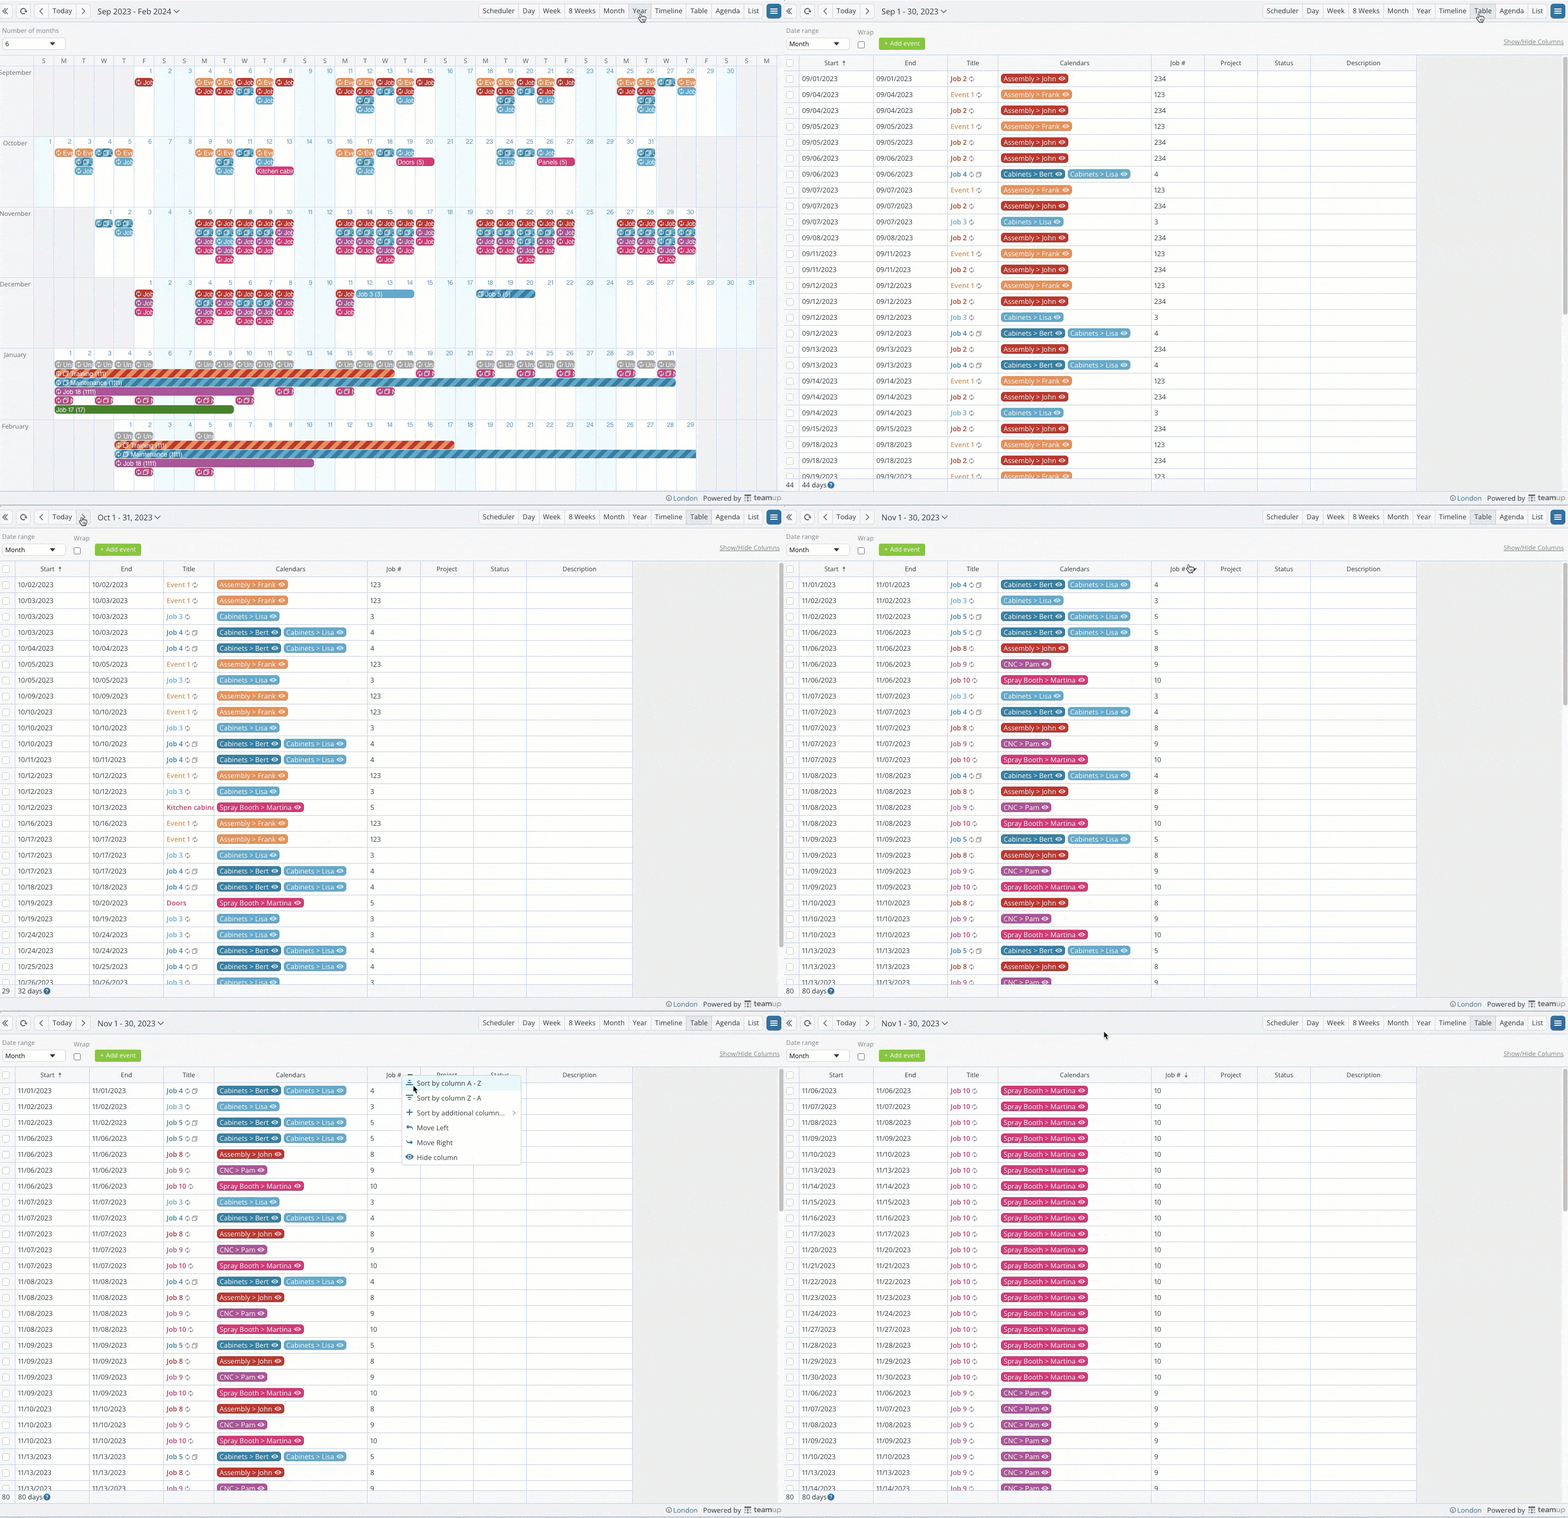
Teamup's Year view provides a long-range view of calendar data. Table view shows calendar data in a spreadsheet-like format. You can use these two views in conjunction to get better insights from your calendar data.
 Click to enlarge image
For example, a small manufacturing plan needs to efficiently schedule their production line.
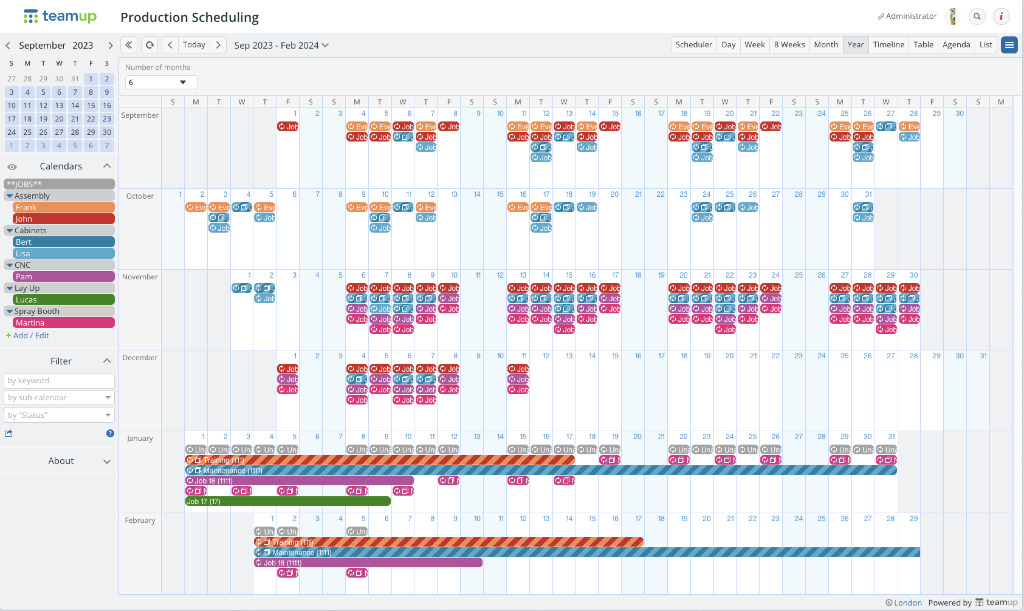
- They can use Year view to get a bird's eye view of the year, quarter, or season. It's easy to notice trends and shifts from what's normal or expected with the Year or multi-month layout.
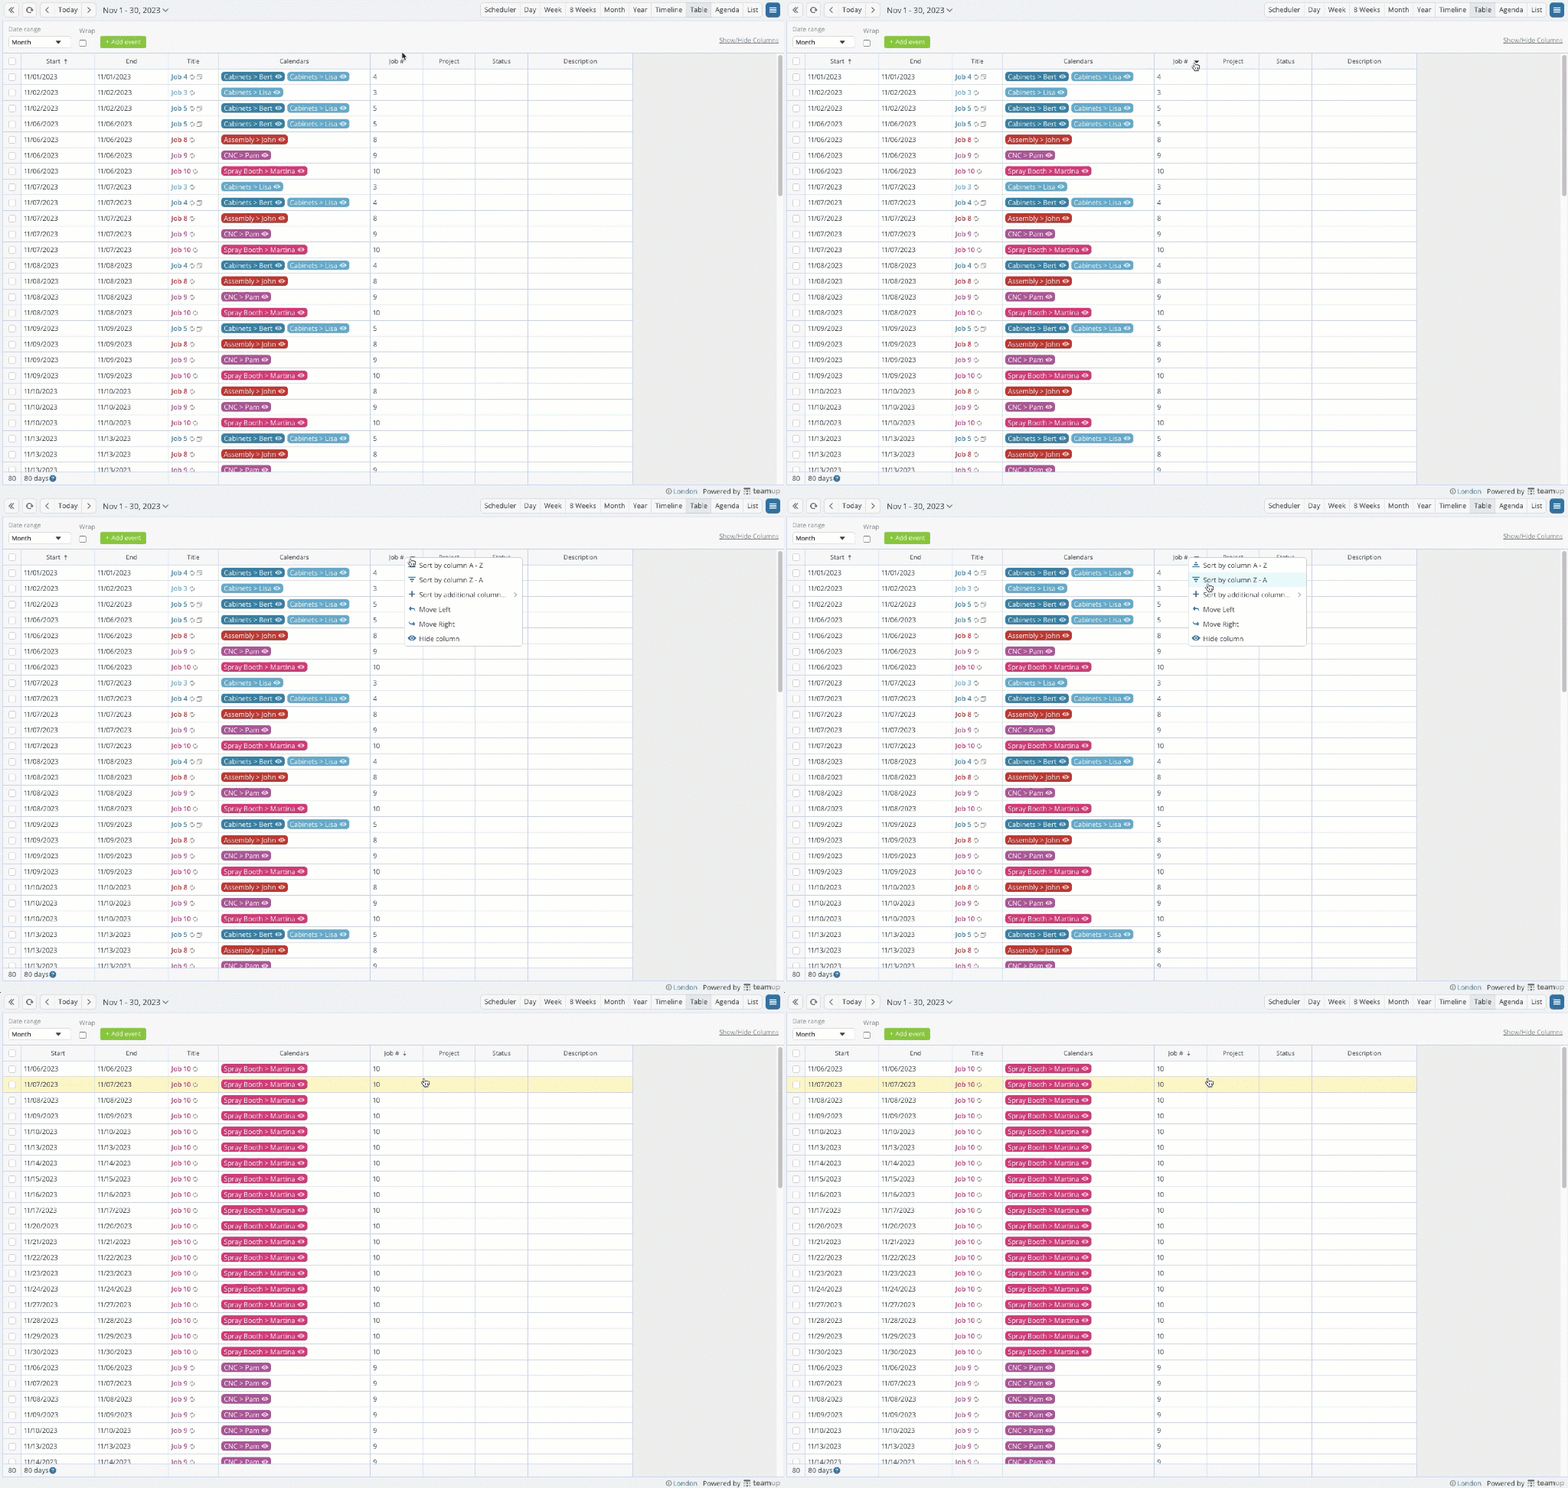
- Then they can switch to Table view for any time period and 'drill down' into what happened or why a change or pattern occurred, sorting data by columns and using built-in filters to gain insights.
See the big picture
They use Year view to see when major orders are coming through and when different parts of the line are under higher demand than normal. This long-range view helps them to schedule material orders in advance, avoid supply chain issues, and prevent bottlenecks in the production line. They can also see when downtimes occur and use those times for equipment maintenance, employee training for certifications, etc.

Sort and filter data
In Table view, they can sort the calendar data to see what might be impacting higher or lower demand, resource availability, or scheduling conflicts. For example, here's a view of one month with a higher-than-usual demand. Sorting by the Job Number column reveals that the higher demand all comes from one large project rather than a change in production types or an increase in smaller orders.

See more about annual organizational planning, a hotel's Year view use case, using Table view to replace spreadsheets, how to do annual reviews and planning, and calculating with Table view.