Teamup Ticker
Three ways to track scheduling data points (like event category or delivery location)
In different scheduling scenarios, there are different data points that matter.
For example, on a booking calendar for shared meeting rooms, the number of participants for each booked meeting tells staff how to set the room up. A community events calendar might show different event categories so folks can find what they're interested in. A custom production company needs the shipping location so they can plan the delivery route.
There are different ways to capture these data points on Teamup.
Sub-calendars

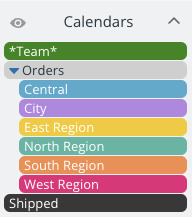
Create a set of sub-calendars in a folder. Each sub-calendar represents one of the options for this data: e.g, a shipping area (West, Central, South, etc.) or an event type (Live music, Sporting events, etc.). When you create an event, assign it to the appropriate sub-calendar in the set (in addition to other sub-calendars, if needed). You can hide or show sub-calendars to focus on one data point at a time, or filter by sub-calendar. Use Scheduler View to view each sub-calendar as a column and easily compare different data points for the day or week.
Custom event fields
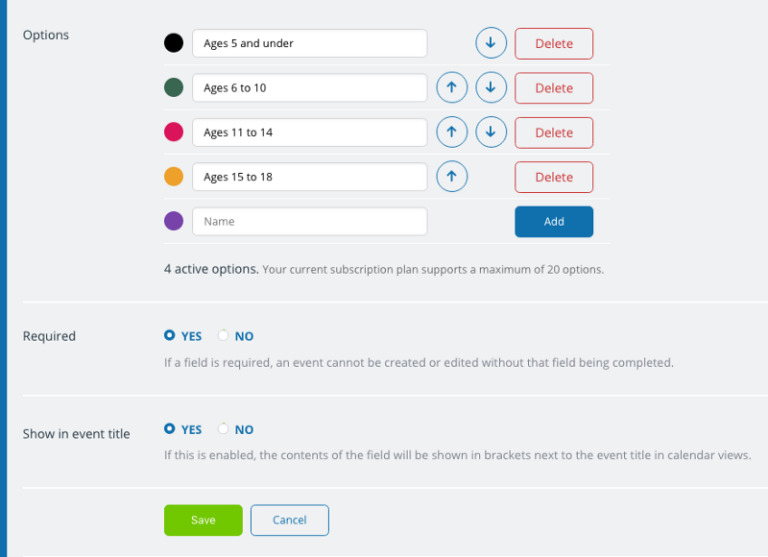
Create a custom event field. To track the number of participants, use a number field or a choice field with options like 6-8 people, 8-12 people, 12-16 people, etc. To capture event type, use a choice field with the event categories as options. You can then easily filter by custom field to see all events of a certain type. Make the field required to ensure that the data is always included.
Keywords
Lastly, you can filter events by keyword. This method is more error-prone, because different users might use different terms to identify areas, event categories, or other data points.
The best method depends on the scenario, and how the data fits into operations.
